
The 10 year Anniversary of the Historic Carolina Tornado Outbreak 4/16/2011

I wrote this blog a few days after the historic tornado outbreak in North Carolina on April 16th, 2011. This ended up being the largest tornado outbreak in state history. 32 confirmed tornadoes occurred in North Carolina on 16 April 2011, the greatest one-day total for North Carolina on record.
A total of 24 individuals lost their lives in North Carolina with thirteen tornadoes classified as strong, some hitting highly-populated areas.
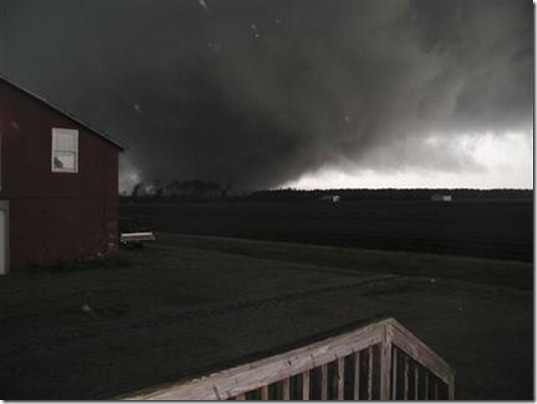
My preliminary findings are that some of the same ingredients that spawned the March 28th, 1984 outbreak were also present in this one. From a synoptic standpoint they were similar but not exact. This time around though 4 key factors have come to my attention and I believe they caused so many significant and long track tornadoes this time around. First though here’s some of the imagery and tracks of the tornadoes I have accumulated so far as of this writing on 4/19/11. This was a huge 3 day outbreak across the entire U.S.
( Image Credit Victor Gensini at UGA.)

Lots of images are mine with some from WRAL-TV, which did outstanding coverage not only because of their knowledgeable meteorologists but their technology. They are lucky to have a radar based in Fayetteville which gave them great views of the storms. They also have one of the first Dual-Pol Doppler radars in the country. Even though it was a great resource these storms were so text book and intense that all the radars detected debris with the long track tornadoes. Below are the tracks of the supercells estimated from the Doppler radar shear(WRAL) and rainfall estimates on the left. The images on the right show the number of warnings issued and the current storm reports.


The radar images were just incredible, most showed well defined hook echoes which in and of themselves are indicative of a tornado. What was even more amazing was the presence of debris balls on the radar imagery. These are basically the Doppler radar detecting debris, i.e… parts of homes, businesses, cars and trees airborne due to the tornado.


To me this picture says it all with the radar & Skycam from WRAL-TV showing the tornado bearing down on Raleigh.

I have all my images saved on my Twitpic account and you can view them by clicking here.
What made these storms so intense? Here are some of the factors I believe contributed to the significant and long track tornadoes.
#1 Very low LCL’s (Lifted Condensation Levels) were present. The storms bases were extremely low meaning the mesoyclones were very close to the ground and made for easy tornado genesis. You can see this from the videos and pictures notice how short and stocky these tornado were. Low LCL’s are known to allow easy formation of tornadoes simple because the distance between the cloud base and ground becomes so small. When the wall cloud forms it shortens the distance further meaning the tornado has a much easier time forming. This has to do with the relationship between the RFD(Rear Flank Downdraft) and the inflow into the storm. Low LCL’s have shown a 64% correlation to significant tornadoes. (source Warning Decision Training Branch (WDTB) Tornado Warning Guidance: Spring 2002)
Below you can see the the NAM forecast on the left and the special 16z sounding from GSO. The WDTB research showed that the median LCL for significant tornadoes was 780m, the sounding from GSO had a LCL of 262m at 16z.


More evidence of the low LCL can be seen from video and pictures. Notice how all the images show a very short and relatively wide vortex. The distance from the clouds base to the ground was extremely small, meaning that the mesocyclone was almost all the way down to the ground.


#2 Gravity waves, these were present on the satellite imagery during the morning over North Carolina and South Carolina. Not only that I noticed them as well near where the Tushka,OK tornado formed on Thursday 4/14/11 and near the Clinton, MS tornado on 4/15/11. Here’s a look at the gravity waves on the satellite imagery from the 3 day outbreak.
Tushka,Oklahoma Clinton, Mississippi


North & South Carolina

Why are these gravity waves important? Meteorologist Dr. Tim Coleman from the University of Alabama at Huntsville found that they compress the storms causing them to spin faster due to conservation of angular momentum. Think figure skater pulling their arms in and spinning faster. Or playing tether ball as the rope gets smaller the ball spins faster around the pole. Coleman also notes, “There is also wind shear in a gravity wave, and the storm can take that wind shear and tilt it and make even more spin. All of these factors may increase storm rotation, making it more powerful and more likely to produce a tornado.” Dr. Coleman has a model that shows how a gravity wave interacts with a tornado. Notice the increase in vorticity as the gravity wave interacts with the storm. (credit Science@NASA)

#3 Wind shear, this was obvious, we had some epic wind shear with this event. The storm relative helicity from the special 16z GSO sounding was 611 m2/s2 at the SFC-1km and the SFC-3km SRH was 702 ms/s2. The STP ( Significant tornado parameter) was off the charts for this reason. STP on the left Skew-T on the right.


#4 The echo tops were key as well. Clearly once these storms hit about 40,000’-50,000’ in height they were able to fully tap into all the shear that was present within the entire column of the lower atmosphere. Part of the reason this happened was due to the heating and the CAPE increasing as clearing was occurring ahead of the front. This CAPE or surface based instability then in turn caused the updrafts to become well established and grow in height. Notice how storm tops changed dramatically from around noon time over the I-77 corridor near Charlotte to around 3pm east towards Raleigh and Fayetteville. Scale is on the left side of the image below.
Storm Tops near Raleigh Storm Tops near Charlotte


Still working on putting stuff together and all of this is just preliminary. This outbreak will go down as one of the biggest in the SE and Carolinas all time. It’s always hard to compare modern outbreaks to older outbreaks due to population density, technology and changes in documentation. I have a few maps via Google Earth I’m working on and will keep studying this event and be on the look out for further posts on the subject. I’d love your feedback and discussion on the topic in the comments section below. Still a work in progress…. bear with me it’s been a long 2 weeks in the Carolinas.
Google Earth Virtual Tour of Sanford-Raleigh tornado track. 20110418071005-4dac463d666f19.08853572.kmz


