November Gale comes early to the Great Lakes
To put you in the mood you have to play this song to know what November gales are all about.
Maybe the biggest storm to strike the Midwest in 70 years or more is on the way. Depending on what part of the Midwest you live in. No matter where you live in the US one thing is for sure that this will be one of these most widespread wind storms to strike the middle of the country in recent memory. What will make this storm so incredible will be the very low pressure it is forecast to bomb out. Depending on the model you look at it could be anywhere from 955-965mb which is 28.20”-28.50” of mercury on the barometer ready for surface pressure. Most meteorologists and pilots get how low this is but for everyone else, let me put this into perspective. We have had 17 named storms in the Atlantic Hurricane season so far. If this storm bombs out to 960mb it will be stronger than 11 out of 17 of those tropical storms and hurricanes this season. This will be a mess brining a moderate risk of severe weather with a potential tornado outbreak for the Ohio Valley. Blizzard like conditions for the Dakotas and Rockies where snow will be measured in feet in some places. Then the WIND, this will be an inland hurricane from Tuesday-Thursday!
Check out the the amount of warnings for winter, storm and snow already posted by the NWS
Here’s a forecast surface map of the storm on late Tuesday evening into Wednesday morning. Notice the pressure 962mb over the arrowhead of MN.
Compared to the “Cleveland Super Bomb of 1978”.
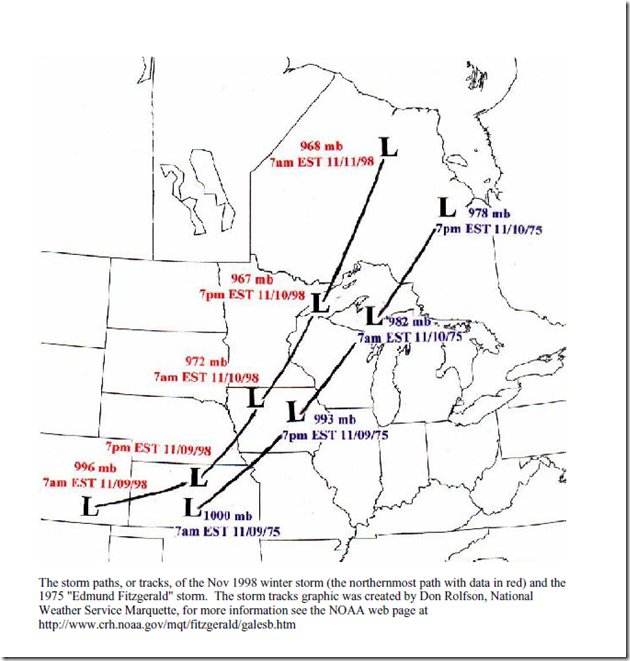
This is the Storm track comparing the Edmund Fitzgerald storm to the 1998 record breaking storm.
How the upcoming cyclone ranks among other notable cyclones over the Great Lakes
PUBLIC INFORMATION STATEMENT
NATIONAL WEATHER SERVICE CHICAGO/ROMEOVILLE IL
1030 AM CDT MON OCT 25 2010
| RANK | EVENT | DATE | MINIMUM CENTRAL PRESSURE |
| 1. | Great Ohio Blizzard | Jan 26, 1978 | 950 HPA / 28.05 inches |
| 2. | Upcoming October event | Oct 26-27, 2010 | 959 HPA / 28.35 inches ** |
| 3. | Armistice Day Storm Anniversary Storm | Nov 11, 1940 Nov 10, 1998 | 967 HPA / 28.55 inches 967 HPA / 28.55 inches |
| 4. | Cyclone of 1913 (aka White Hurricane) | Nov 7-9, 1913 | 968 HPA / 28.60 inches |
| 5. | Edmund Fitzgerald Storm | Nov 10, 1975 | 980 HPA / 28.95 inches |
* AVERAGE AMONG SEVERAL CURRENT FORECAST MODELS
| MICHIGAN | ||||
| Alpena | 31.09 | 2/9/1934 | 28.40 | 1/1/1864 |
| Detroit | 31.04 | 3/5/1948 | 28.30 | 1/26/1978 |
| Grand Rapids | 31.07 | 1/26/1927 | 28.72 | 3/22/1955 |
| Marquette | 31.08 | 1/26//1927 | 28.63 | 12/14/1920 |
| Sault St. Marie | 31.15 | 1/26/1927 | 28.58 | 11/29/1919 |
| MINNESOTA | ||||
| Duluth | 31.10 | 1/17/1989 | 28.48 | 11/10/1998 |
| International Falls | 31.08 | 1/10/1949 | 28.70 | 11/10/1949 |
| Minneapolis/St. Paul | 31.09 | 1/17/1989 | 28.55 | 11/10/1998 |
| Rochester | 31.06 | 2/1/1959 | 28.47 | 11/10/1998 |
| NORTH DAKOTA | ||||
| Bismarck | 31.24 | 2/17/1989 | 28.62 | 3/15/1920 |
| Fargo | 31.18 | 12/28/1917 | 28.54 | 3/15/1920 |
| Williston | 31.24 | 1/9/1962 | 28.84 | 1/11/1932 |
| SOUTH DAKOTA | ||||
| Huron | 31.18 | 12/28/1917 | 28.66 | 3/26/1950 |
| Rapid City | 31.15 | 2/11/1899 | 28.85 | 1/10/1980 |
| Sioux Falls | 31.12 | 3/11/1998 | 28.63 | 3/26/1950 |
| WISCONSIN | ||||
| Green Bay | 31.09 | 1/26/1927 | 28.69 | 12/14/1920 |
| La Crosse | 31.10 | 1/26/1927 | 28.72 | 11/11/1940 |
| Madison | 31.06 | 1/26/1927 | 28.68 | 1/3/1906 |
| Milwaukee | 31.00 | 1/16/1989 | 28.77 | 2/28/1902 |
| ILLINOIS | ||||
| Cairo | 31.00 | 1/7/1968 | 28.91 | 2/10/1960 |
| Chicago | 30.97 | 1/16/1989 | 28.60 | 2/28/1902 |
| Moline | 31.02 | 12/20/1924 | 28.60 | 2/28/1902 |
| Peoria | 31.01 | 12/20/1924 | 28.89 | 3/11/1923 |
| Springfield | 30.99 | 1/7/1968 | 28.71 | 2/28/1902 |
| INDIANA | ||||
| Evansville | 30.99 | 12/10/1919 | 28.93 | 2/28/1902 |
| Fort Wayne | 30.97 | 1/26/1927 | 28.60 | 1/9/1963 |
| Indianapolis | 30.97 | 2/12/1981 | 28.78 | 2/28/1902 |
| IOWA | ||||
| Des Moines | 31.06 | 2/1/1959 | 28.76 | 2/28/1902 |
| Dubuque | 31.03 | 1/26/1927 | 28.68 | 1/3/1906 |
| Sioux City | 31.09 | 12/29/1917 | 28.66 | 3/26/1950 |
| Waterloo | 31.05 | 2/1/1959 | 28.74 | 1/10/1975 |


