Vortex Hole during Vale, NC Tornado–Updated
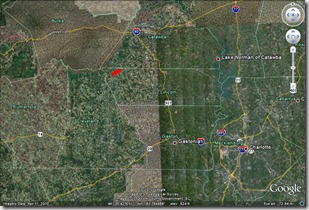
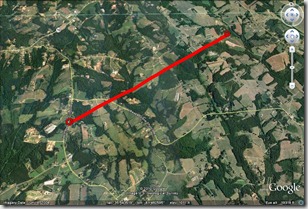
On the night of Tuesday October 26th, 2010 a strong Tornado touched down near the Cleveland/Lincoln county line and the damage was rated EF-2 by the national weather service in Greer, SC. It moved Northeast to an area just 2 miles west of Vale, NC in Lincoln Co. Below is the damage path that was about 3 miles long and 200 yards wide. Max winds were estimated at 135mph. Here’s a link to the PNS from NWFO GSP and here are the aerial pictures of the destruction from our website wcnc.com.
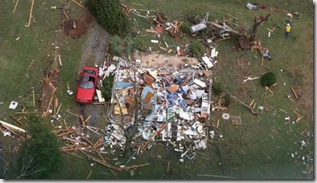
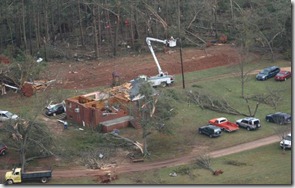
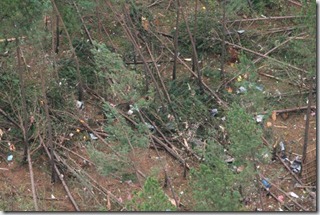
Damage from our helicopter showed one framed home completely destroyed and another brick home with the whole roof and several walls collapsed. This is easily EF-2 damage and bordered on EF-3 damage. Notice extensive tree damage as well with a convergent pattern of the tree fall.
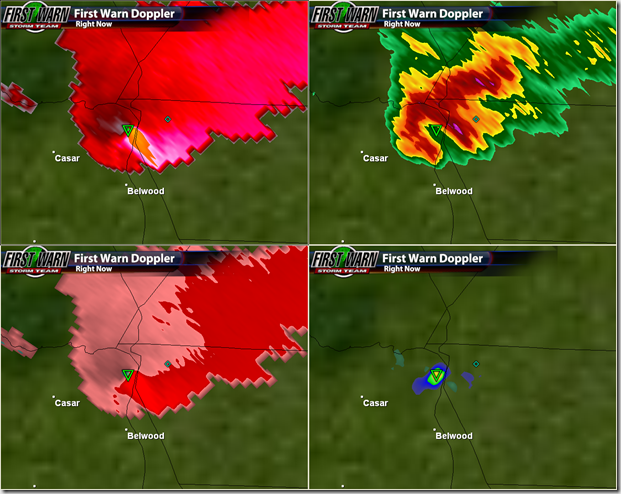
I went back and looked at the volumetric Doppler radar data from our GR2Analyst and detected just how deep and strong this rotation was. The first image is a four panel of the products I most often use in tornado detection.
Base Velocity Reflectivity
Storm Relative Velocity NROT (Normalized Rotation)
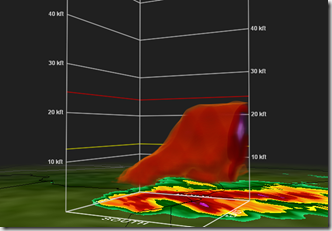
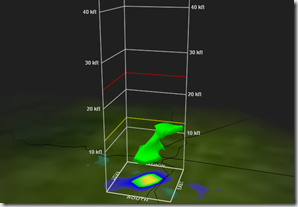
The amazing stuff is when you look at the volumetric data or 3d views. You can see the rotation quite nice along with parts of the BWER or Bounded weak echo region on the left here.
You can also see a hail core aloft at around 18,000’ which is quite low. Not totally sold on this being hail as the –20 degree line is closer to 25k’.
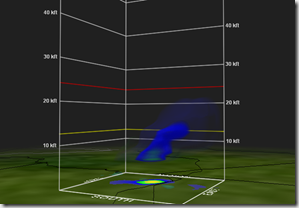
Next…here is where things start to look very interesting when you look at the NROT or normalized rotation product. This basically shows rotation over a small area, Otherwise this is the vortex of the tornado. Notice how strong and tight the rotation is and how deep it is. Elements of the circulation go all the way up to 20,000’ on the left below. The strongest rotation is in green on the right below and it goes all the way up to 12-13,000’.
NROT
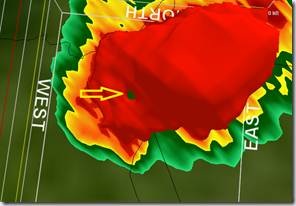
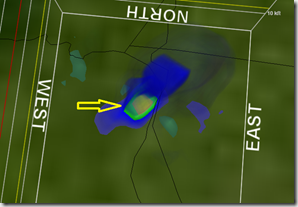
The next thing I came across was something I have read several research papers on and Mike Gibson(Genius behind this software) and I have talked about at the most recent NWAS10 in Tucson, AZ. Something called a vortex hole or weak echo region in reflectivity data, where the tornado is detected. This essentially is the eye of the tornado though oversimplified a bit. The next views are from directly above the super cell. These are from the exact same time and same volume scan, notice the hole in the 50dbz reflectivity all the way down to the ground. Then on the right is NROT or the rotation which is right around where the hole is on the reflectivity. Remember these are identical volume scans just 2 different products.
I believe this hole is a weak echo region of sinking air in the middle of the rotation and the reflectivity is rain wrapping around the vortex creating this vortex hole. I’d love your thoughts on this or any research or similar type vortex holes you have seen. Just post them in the comments section of the blog.
Updated to add TDWR data from TCLT
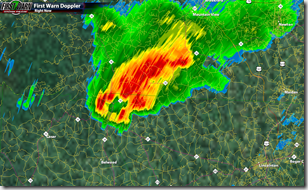
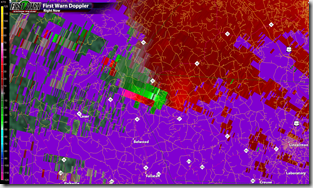
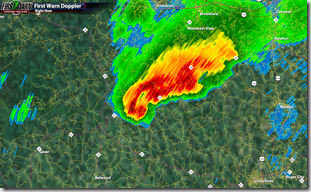
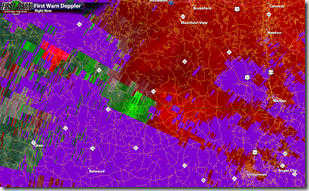
This data is from the FAA TDWR located just 32nm away and at a tilt of just 0.02°. The reflectivity hole is visible here on the left below as well. The beam is intersecting the storm at ~1400’. Velocity data on the right below. Time 10/26/10 7:09pm
These two are at 7:14pm notice still a nice hook and smaller vortex hole and possibly a small debris ball at the end of the hook. I should also be noted too that our Radtec C-band radar in Dallas, NC just 31 miles away we also noted a debris ball during our live Tornado coverage on WCNC-DTV.

