
Here’s how hot this summer was by the numbers.
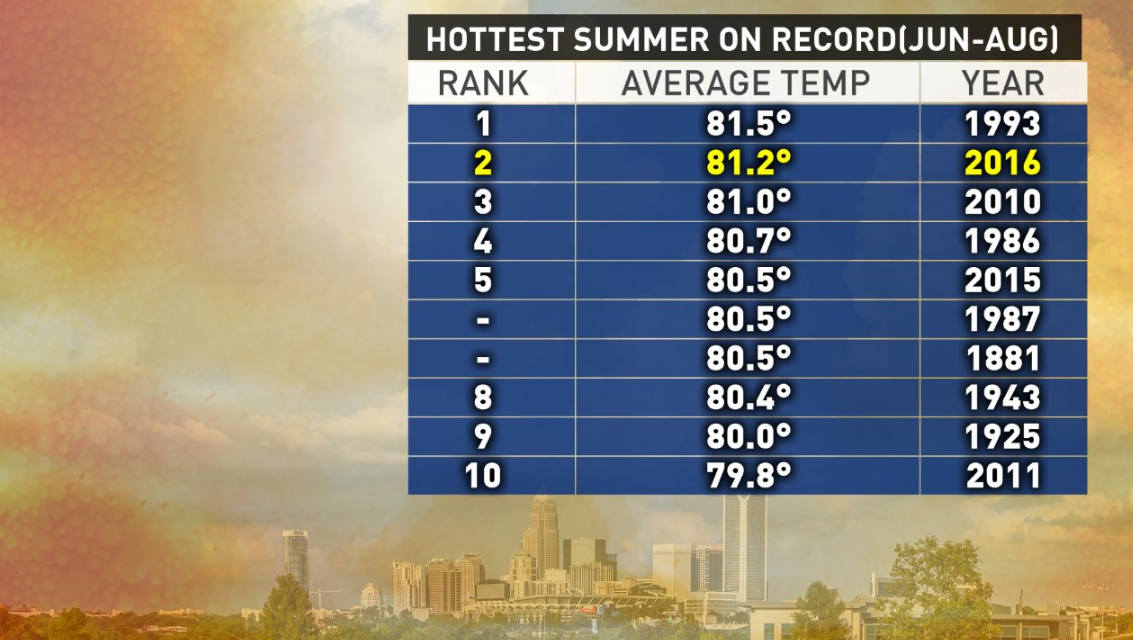
I don’t think to many people will be shocked to hear that this was the second hottest summer on record here in Charlotte. Our records go all the way back to 1878. So we just saw the 2nd hottest summer in the past 138 years in the Queen City.
I went back and pulled all the climate data for this past season and compared it to the top ten hottest and top ten driest on record. The heat wasn’t just about the high temperatures it was equally about the low temperatures. To think we had the second hottest summer without hitting 100° even once should tell you something. The nights were unusually warm which I would attribute to the higher humidity we had this summer.
So here we go the summer heat by the numbers. Just to be clear meteorological summer is used for climate data. So we are talking June 1 through August 31st. We don’t use Astronomical season in weather because the dates change and thus you can compare numbers correctly.
Average Temperature 2nd highest on record:
This is the number one way to measure a season based on the average temperatures. This is taking all the highs and all the lows then adding them up dividing by the numbers of days in summer. You get the average temperature, which is amazing to think that it was well over 80°. Meaning the average temperature 24hrs a day was always above 80°.

Average High Temperature, 2nd highest on record:
So this is just all the highs averaged out over the entire summer. So you can safely say it was basically 92° every day this summer and that’s the 2nd highest on record.

Number of days 95° or higher, 4th most on record:

Number of days 90° or higher just June-August, 2nd most on record:
Average low temperature, 3rd highest on record:
To me, this is what I will remember most about this summer. Last summer was hot, but it was still nice at night. This summer was always hot and humid no matter the time of day.

Number of low temperatures 70° or higher, the most on record:
We tied a record in July and August of 33 straight days without it ever falling below 70°. That was the most ever.

Rainfall, 6th lowest on record:
This amazed me became last summer we had a horrible drought but 2016 we actually had less rain. It was more humid which maybe made it feel like we had more rain.

Heat Index hours above 100°, most since 2011:
We don’t have really good data on dew point records or humidity. This is the next best thing because this shows you how hot it felt. We had just under 80 hrs of the heat index values at 100° or higher. That was the most since 2011.

Cooling degree days, 2nd most on record:
Cooling degree days are a measure of how much (in degrees), and for how long (in days), the outside air temperature was above a certain level. They are commonly used in calculations relating to the energy consumption required to cool buildings.
So this bascially tells you how high your air conditoner bill was!
( 90°F + 66°F ) / 2 = 78°F
Because the result is above 65°F:

It was just flat out a hot summer and there has been a pattern of these hotter summer over the past 10 years. It’s something to think about as you plan for home improvemtns and energy costs going forward. There may be many more summers like this over the next few years.

